If you’re designing a part or a mold for Liquid Silicone Rubber (LSR), one question is paramount: What is the shrinkage rate of LSR? Unlike a simple yes-or-no question, the answer is a range influenced by a complex interplay of material chemistry and processing conditions. Getting this number wrong can lead to costly misfits, functional failures, and wasted production runs.
This comprehensive guide dives deep into everything you need to know about the shrinkage rate of LSR. We will move beyond a simple number to explore the why and the how, empowering you to design with confidence and precision. Understanding LSR shrinkage is not just a technical step; it’s the foundation of manufacturing high-quality, dimensionally accurate silicone products.
What is the Shrinkage Rate of LSR?
The typical shrinkage rate for LSR falls within a range of 0.9% to 1.4%. A common and often reliable average used by many mold designers is approximately 1.0%.
However, simply using 1.0% for every project is a risky oversimplification. This range exists because shrinkage is not an intrinsic, fixed property like density. It is the result of the material’s reaction to the molding process. The precise value for your project depends on the specific LSR grade, the part geometry, and, most critically, your molding parameters.
Why Does LSR Shrink?
To master shrinkage, you must first understand its causes. LSR shrinkage occurs primarily due to two factors:
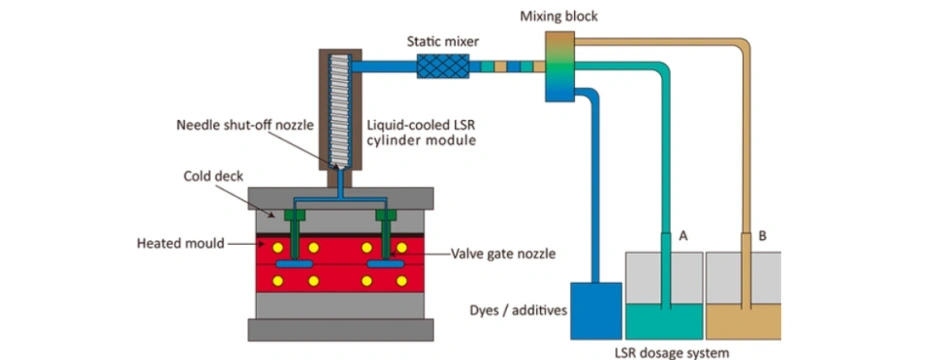
- Thermal Contraction: LSR is injection molded at high temperatures (typically 150-200°C or 300-390°F). As the cured part cools to room temperature, the polymer chains lose kinetic energy and move closer together, causing the material to contract. This is the dominant factor for LSR shrinkage.
- Chemical Cross-Linking: LSR is a thermoset material that cures through a platinum-catalyzed addition reaction. This process forms a dense, three-dimensional network of cross-links. The formation of these chemical bonds can also lead to a slight volumetric reduction, contributing to the overall shrinkage.
Key Factors Influencing the Shrinkage Rate of LSR
Why can’t we have one universal number? Here are the critical variables that affect the final shrinkage rate:
- LSR Material Formulation: Different LSR grades have different shrinkage rates.
- Shore Hardness: Softer grades (e.g., Shore A 20-40) often have a slightly higher shrinkage rate than harder grades (e.g., Shore A 70-80).
- Fillers and Additives: LSR compounds loaded with high levels of fillers (like silica) for specific properties (e.g., thermal conductivity, flame retardancy) will exhibit different shrinkage behaviors compared to pure, unfilled grades.
- Part Geometry and Wall Thickness: This is a major factor. Thick sections cool more slowly than thin sections, leading to differential shrinkage. This can cause warping, sink marks, or internal stresses if not properly accounted for in the mold design.
- Curing Temperature: Higher curing temperatures generally lead to higher shrinkage due to increased thermal contraction. However, a complete cure is essential for optimal material properties.
- Post-Curing: Many LSR parts undergo a post-curing cycle (e.g., 1-2 hours at 150-200°C) to enhance properties. Post-curing will cause additional shrinkage, typically in the range of 0.1% to 0.3%. This must be factored into the final mold dimensions if post-curing is part of the production process.
- Batch Variations: While high-quality LSR suppliers maintain tight tolerances, minor batch-to-batch variations can occur.
LSR vs. Thermoplastic Shrinkage: A Critical Distinction
Designers familiar with thermoplastics (like ABS, Nylon, or Polypropylene) must understand a key difference. Thermoplastics shrink primarily due to crystallization and thermal contraction, and their shrinkage can be highly anisotropic (different in flow vs. cross-flow directions).
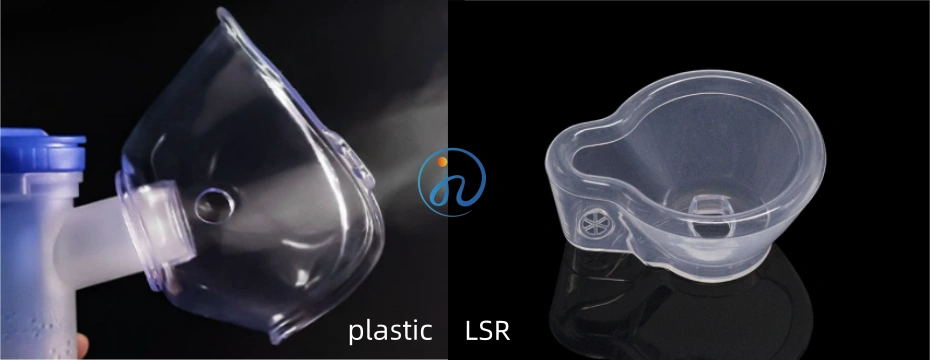
LSR shrinkage is generally more isotropic (uniform in all directions) due to its low viscosity and the nature of the cross-linking reaction. This makes it somewhat more predictable. However, in complex parts with varying flow paths, some anisotropy can still occur.
Consequences of Ignoring Correct Shrinkage Rates
Failing to accurately account for shrinkage leads directly to:
- Dimensional Inaccuracy: Parts that are too small or too large, failing to meet specifications.
- Assembly Issues: Parts that do not fit together with other components.
- Functional Failure: For seals and gaskets, incorrect dimensions mean leaks and loss of functionality.
- Costly Mold Modifications: Correcting a finished mold is expensive and time-consuming. Prevention is always cheaper than correction.
FAQ: Shrinkage Rate of LSR
Q1: Can the shrinkage rate of LSR be reduced?
A: It can be managed but not fundamentally eliminated. Using filled compounds, optimizing process parameters (like lower mold temperature, if possible), and controlling the cure cycle are the primary methods. The goal is predictability, not elimination.
Q2: Is LSR shrinkage linear?
A: Generally, yes, it is considered linear, which is why the simple percentage-based calculation is effective for most applications.
Q3: Where can I find the exact shrinkage rate for my LSR material?
A: The definitive source is the Technical Data Sheet (TDS) provided by the material manufacturer (e.g., Dow, Wacker, Momentive). This sheet provides the tested shrinkage rate under specific conditions.
Conclusion: Mastering the Shrinkage Rate of LSR
The question “What is the shrinkage rate of LSR?” is the starting point for precision engineering. While the answer lies between 0.9% and 1.4%, true expertise lies in understanding the factors that influence this range.
By collaborating closely with your material supplier, carefully considering part design, and accurately compensating in your mold, you can transform the challenge of shrinkage from a source of defects into a predictable, manageable part of your manufacturing process. Remember, in the world of LSR molding, precision in design guarantees perfection in the final product.